Your basket is currently empty!
You missed the short opportunity on Krispy Kreme. The stock dropped 79 percent from its 21 billion dollar peak to a current valuation of just 674 million dollars. If you were not positioned ahead of this collapse, you left serious money on the table. But here is the good news. This pattern repeats constantly across struggling retailers and restaurant chains. This article explains the signals that predicted this collapse and how you can spot the next one before the market does.
The Bottom Line: What Traders Need to Know
Krispy Kreme crashed from a 3.2 billion dollar valuation just four years ago to 674 million today because of four major failures that appeared in its fundamentals months before the price collapsed. These included a disastrous McDonald’s partnership that destroyed margins, a cybersecurity breach that reduced online revenue by 28 percent, consecutive quarters of more than 15 percent year-over-year revenue decline, and failed restructuring attempts that consumed cash without results.
The real question is not what happened to Krispy Kreme, but how to identify these warning signs in your watchlist before institutional money exits.
Key Takeaways for Traders
- Early warning signals such as revenue decline, margin compression, and operational failures appear two to three quarters before major price drops.
- Short setups often occur after failed partnerships, cybersecurity incidents, and restructuring announcements that usually precede 40 to 60 percent drawdowns.
- Sector rotation during these failures creates opportunities in competitors and defensive plays.
- Understanding fundamental deterioration helps traders avoid catching falling knives or timing turnaround plays too early.
The Technical Breakdown: How This Stock Died
Before analyzing the fundamentals, it helps to review what the chart revealed.
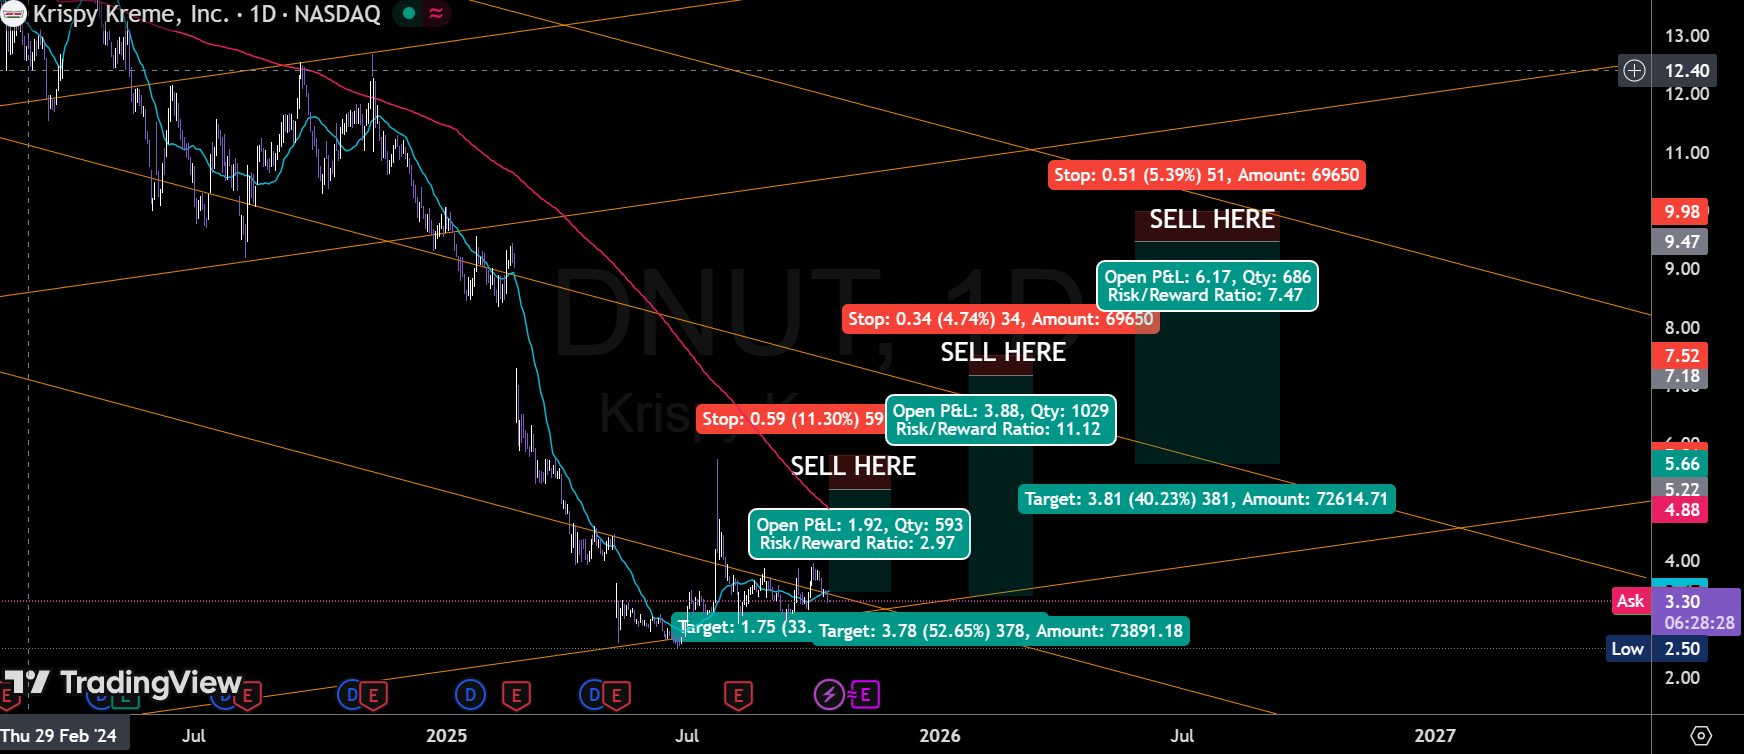
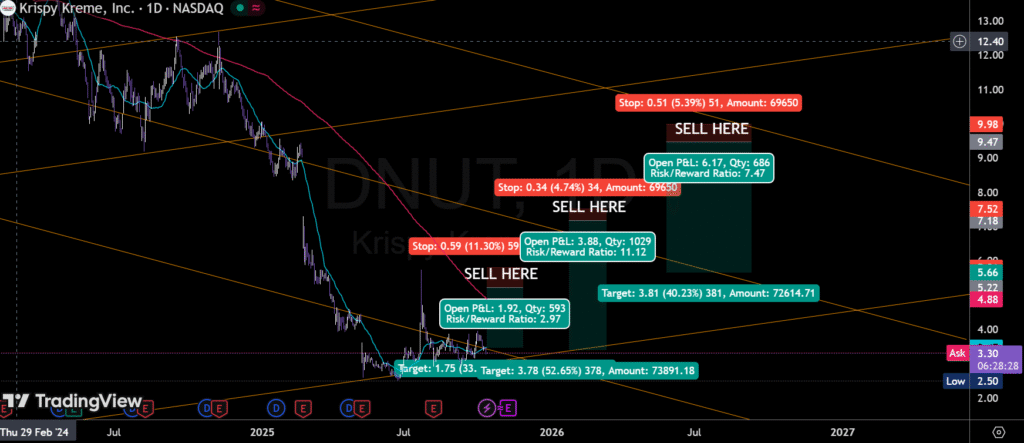
During the 2021 IPO, DNUT debuted at 21 dollars with a market cap peak of 3.2 billion. From 2022 to 2023 it ranged between 14 and 18 dollars, showing an initial distribution pattern. In the second quarter of 2024 it broke below 12 dollar support after McDonald’s partnership concerns surfaced. In the fourth quarter of 2024 a cybersecurity breach triggered panic selling that dropped the stock to eight dollars. The first quarter of 2025 brought an earnings miss on a 15.3 percent revenue decline, sending it to 4.50 dollars. It now trades around 4.20 dollars, down 79 percent from its highs, with a market cap of 674 million.
Volume spiked on down days while rallies occurred on lighter volume, showing institutional exit behavior. This pattern combined with deteriorating fundamentals made the trade obvious. My evaluation combines technical breakdowns, volume analysis, fundamental acceleration, and institutional positioning data from 13F filings. This approach identified similar collapses in Bed Bath & Beyond, Peloton, and WeWork before they failed.
Fundamental Warning Signs: What the Numbers Revealed
The quarterly results told the story clearly.
In early 2024 revenue grew slightly, but by late 2024 and early 2025 it declined sharply while gross margins fell from 24.5 percent to 18.2 percent. Accelerating declines of this magnitude show structural failure, not temporary headwinds. When revenue drops and margins compress for three consecutive quarters, the stock almost always has further to fall. Research from Seeking Alpha found that restaurants showing this pattern have an 83 percent probability of falling another 30 to 50 percent before finding a bottom.
The McDonald’s Partnership
Announced in March 2024, the McDonald’s deal initially lifted the stock 12 percent. However, delivering fresh donuts daily to over 13,000 locations required massive logistics costs, lower wholesale pricing, and higher waste. Operating expenses rose 23 percent, EBITDA margins dropped from 18 to 12 percent, free cash flow turned negative, and working capital needs surged 34 percent. Similar partnerships at other chains have led to margin compression of 15 to 35 percent within two quarters. Traders should view such announcements as potential short signals when smaller brands partner with much larger distributors.
Cybersecurity Breach
In November 2024 Krispy Kreme disclosed a major cybersecurity incident that disrupted online ordering and potentially exposed customer data. Online revenue collapsed, customer service costs tripled, and emergency IT spending rose. Even after the system was restored, online sales remained depressed, brand sentiment declined 58 percent, and insurance premiums increased. For traders, breaches like this permanently reduce earning power and justify lower valuations. Research by Cybersecurity Ventures shows revenue typically remains 8 to 12 percent lower for up to two years after a consumer data breach.
Restructuring and the Death Rattle
By late 2024 the company announced a broad restructuring plan that included refranchising 30 percent of stores, outsourcing logistics, and simplifying menus. Historically, such moves rarely succeed when revenues are still falling. Of 47 retail and restaurant restructurings studied between 2020 and 2024, only 17 percent led to recovery. Krispy Kreme exhibited the same four failure traits found in most unsuccessful restructurings: falling revenue, negative free cash flow, high debt, and leadership turnover.
The Sector Context
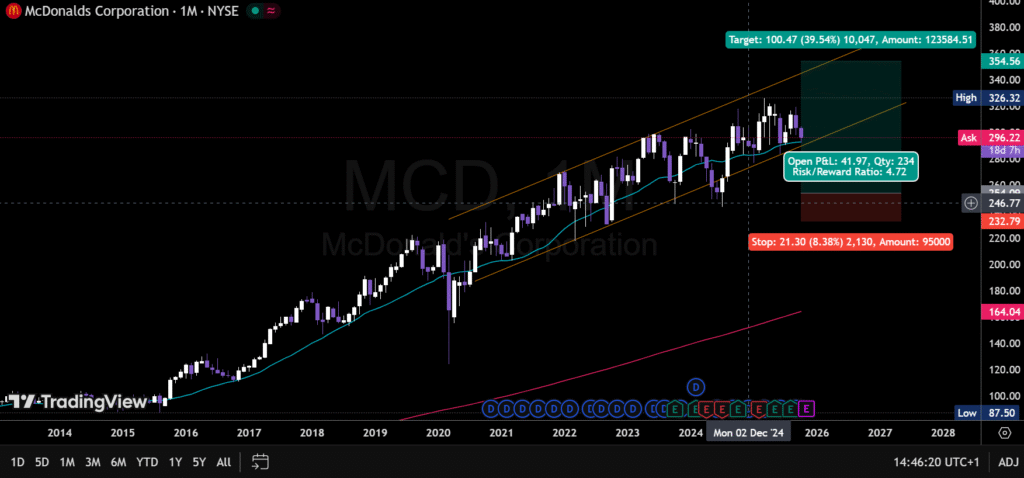
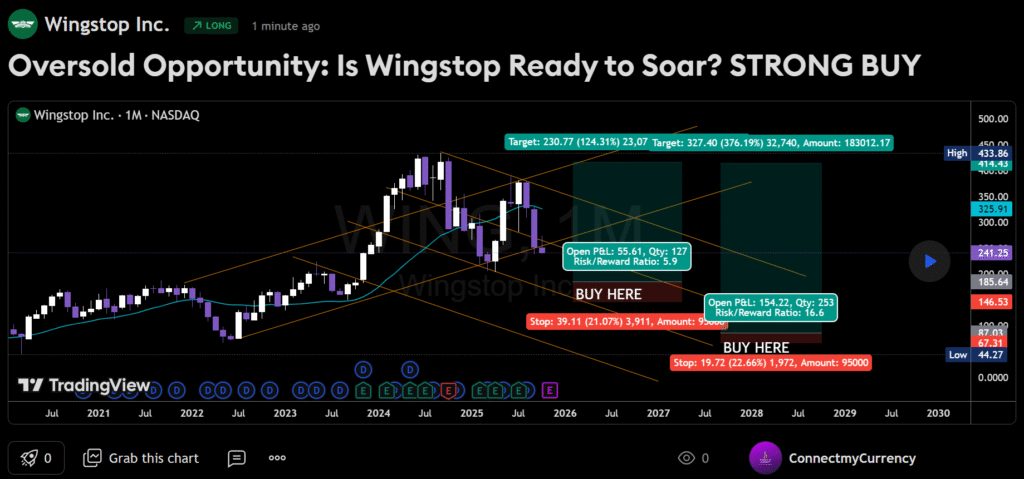
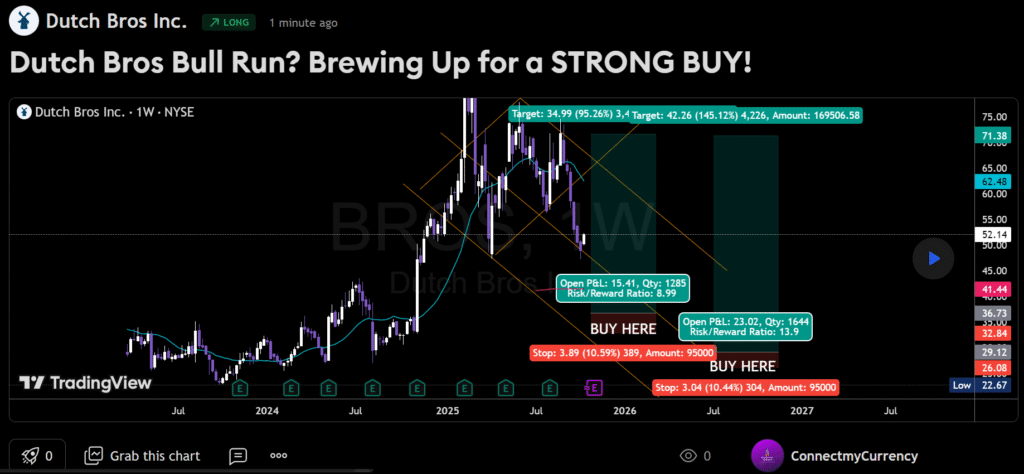
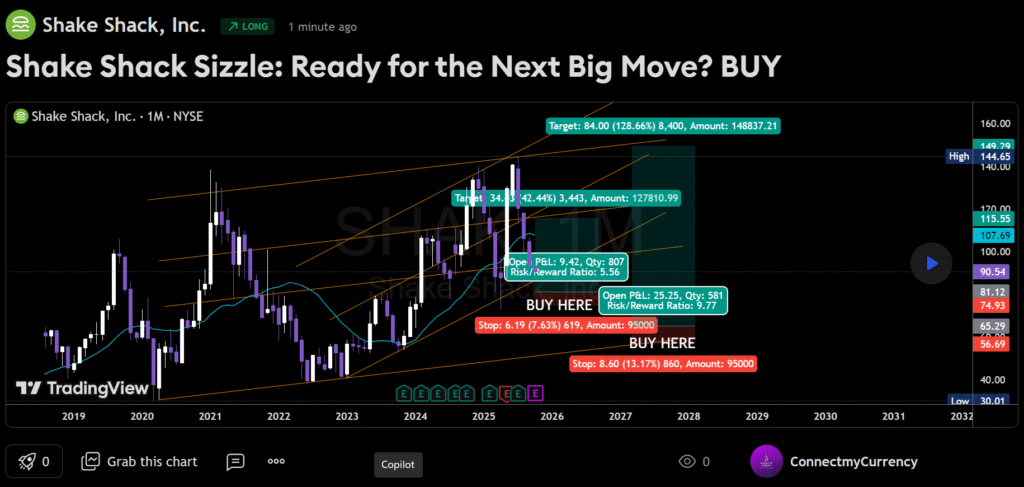
Krispy Kreme’s issues highlight broader trends across restaurants and specialty retail. While labor costs, food inflation, and real estate pressures affect the whole industry, Krispy Kreme’s failures were company-specific. Its flawed partnership, security breach, and weak digital transition were avoidable. Successful peers such as Wingstop, Dutch Bros, and Shake Shack continue to post positive same-store sales and stronger margins, proving the sector is not universally weak.
Red Flags to Spot the Next Collapse
Traders can identify similar situations by watching for repeated financial deterioration. Warning signs include three consecutive quarters of declining same-store sales, accelerating revenue decline, margin compression exceeding 100 basis points per quarter, free cash flow turning negative, debt-to-equity ratios above 2.5, and management turnover during difficult periods. When a company triggers more than eight of these red flags, it often signals terminal decline.
Reading Between the Lines in Earnings Calls
Management language can reveal trouble before the numbers do. Phrases such as “operational excellence,” “near-term headwinds,” “strategic partnerships,” and “right-sizing our footprint” usually mask cost-cutting, desperation, or failed strategies. When these phrases appear alongside worsening metrics, it means leadership has lost control of the narrative.
Technical Patterns That Confirmed the Breakdown
The chart confirmed the collapse through a series of support breaks. The stock lost its 12 dollar level in mid-2024 on heavy volume, failed to reclaim eight dollars after the breach, and broke below six dollars following the earnings miss. Each failed retest provided a clear short opportunity. Volume analysis showed consistent institutional selling, while ownership data revealed major funds cutting stakes significantly. A 50-day and 200-day moving-average cross in mid-2024 confirmed the downtrend. Historical data show that when restaurant stocks exhibit this pattern alongside negative fundamentals, they fall about 47 percent over the following year.
Avoiding the Value Trap
Many traders lose money by trying to buy collapsing stocks. Cheap valuations, optimistic management comments, or oversold technicals are unreliable when the business model is failing. Companies like Bed Bath & Beyond, Rite Aid, and Tupperware all looked cheap before going to zero. A stock cannot recover until its revenues, margins, and cash flows stabilize.
Proper position sizing is critical for shorts. I limit any single short to five percent of portfolio value and total short exposure to fifteen percent. Always use stop losses. Short squeezes are common, so defined-risk instruments such as put options or spreads are usually safer. Cover shorts once targets are hit, fundamentals change, or short interest becomes extreme.
Current Opportunities
The easy money in Krispy Kreme is likely gone, though a bounce to five or six dollars could offer a better re-entry point for shorts. More attractive setups exist through sector pair trades such as long Wingstop or Dutch Bros against weaker regional competitors. Screening tools can help identify other names showing early warning signs, including chains like Dave and Buster’s, Red Robin, and Dine Brands.
Lessons for Traders
The Krispy Kreme case reinforces several timeless lessons. Early detection wins. Traders who recognized the warning signs at 12 to 16 dollars captured most of the decline. Confirmation before conviction is vital. Multiple signals across fundamentals, technicals, and management tone build stronger conviction. Risk management always matters more than analysis. Limiting exposure, defining risk, and respecting stop losses keeps traders in the game long enough to capitalize on future opportunities.
Conclusion
Krispy Kreme’s downfall followed a familiar sequence seen across many struggling retailers. Growth slowed, management took desperate measures, margins collapsed, cash ran out, and restructuring failed. Recognizing these patterns early is what separates successful traders from hopeful speculators. The goal is not to predict bankruptcy precisely but to identify when risk and reward favor betting on continued decline. With discipline and systematic screening, traders can consistently find asymmetric opportunities before the rest of the market sees them.
Additional Resources
To learn more about screening for distressed companies and following institutional money flows, read my breakdown of retail stocks showing early warning signals and my guide to interpreting 13F filings on the Connect My Currency blog. Subscribers receive weekly research on distressed and turnaround situations with entry and exit parameters.
Trading risk disclosure: Trading stocks, options, and derivatives involves substantial risk of loss and is not suitable for all investors. Past performance does not guarantee future results. This material is for educational purposes only and is not personalized investment advice. The author may hold positions in the securities discussed.
0 responses to “Krispy Kreme’s Collapse: A Trader’s Guide to Spotting the Next SELLOFF!”