Precision Over Hype: The Strategy That Doesn’t Miss
Disciplined Growth and Control
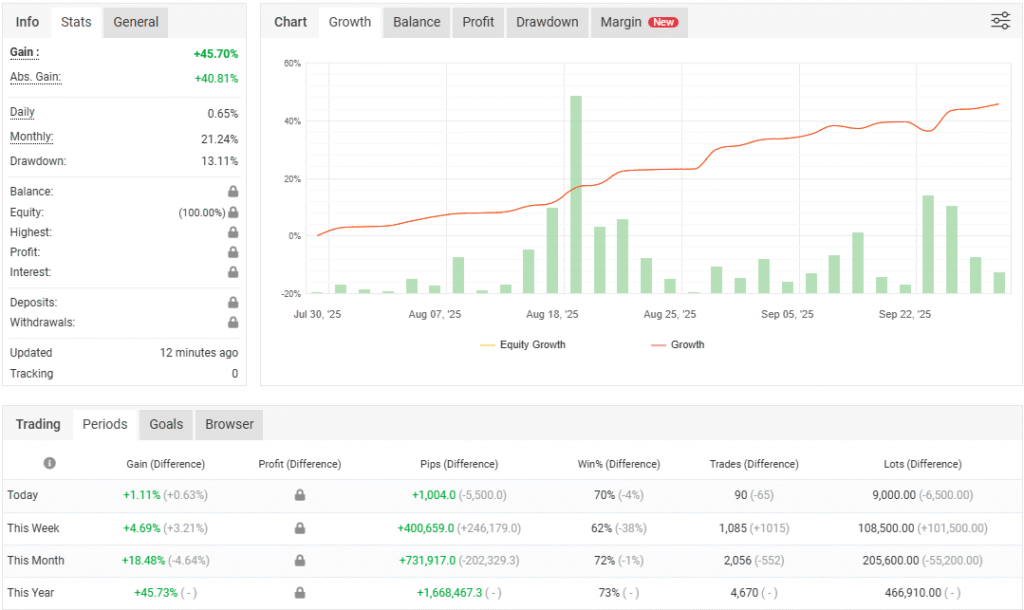
This strategy has delivered a +45.70% gain August 2025 -to-date, with consistent monthly returns averaging 21.16% and a daily pace of 0.65%-2%. Drawdown remains tightly managed at 13.11%, reflecting strong risk discipline.
Advanced Statistics Summary
Statistical Edge, Proven Over Time
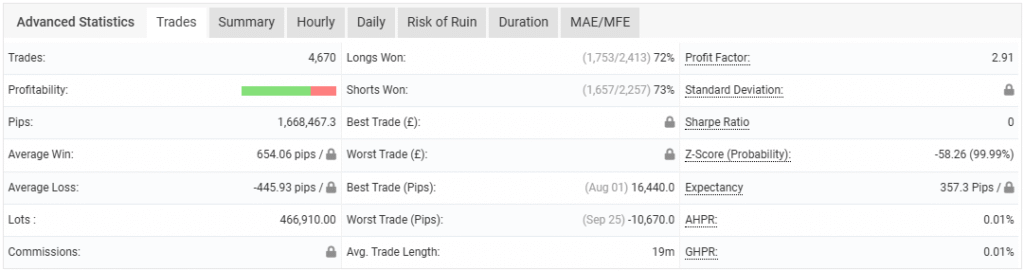
With 4,670 trades executed, this strategy maintains a balanced win rate across both directions:
Longs Won: 41.52% Shorts Won: 41.35%
Key metrics:
This is not random success it’s a statistically validated edge.
Profit Factor: 2.91
Expectancy: 357.3 pips
Average Win: 654.06 pips
Average Loss: 445.93 pips
Total Pips: 1,686,647.3
Trade Length: 19 minutes average
Asset-Level Performance Diagnostics
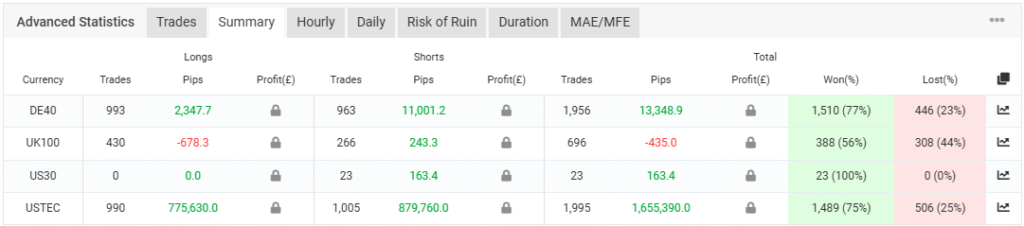
Each instrument is tracked with full breakdowns of trade count, pip yield, and win/loss ratios.
- USTECH: 1,905 trades, 1,655,390.1 pips, 97% win rate
- DE40: 1,956 trades, 13,348.9 pips, 77% win rate
- US30: 23 trades, 168.4 pips, 100% win rate
- UK100: 420 trades, -578.3 pips
Trading is probabilities, not emotional decision making. Underperformers are cut without hesitation.
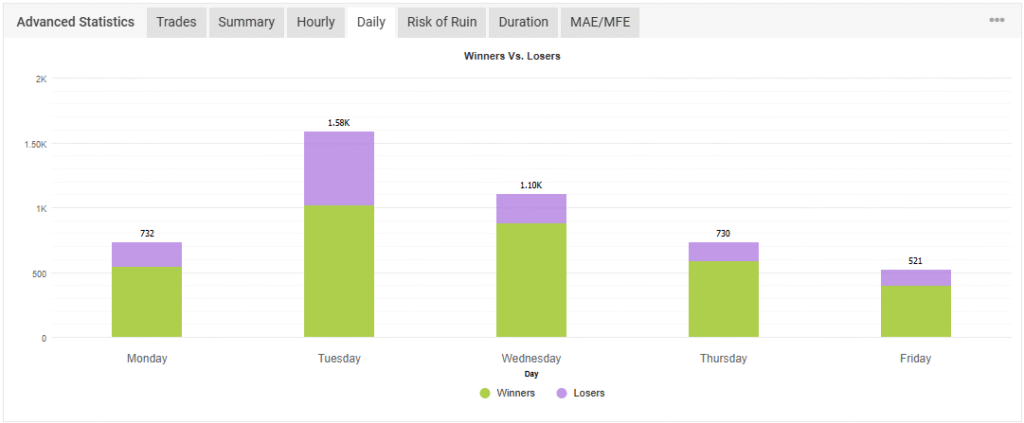
Hourly Winners vs. Losers Chart
Time-of-Day Optimization
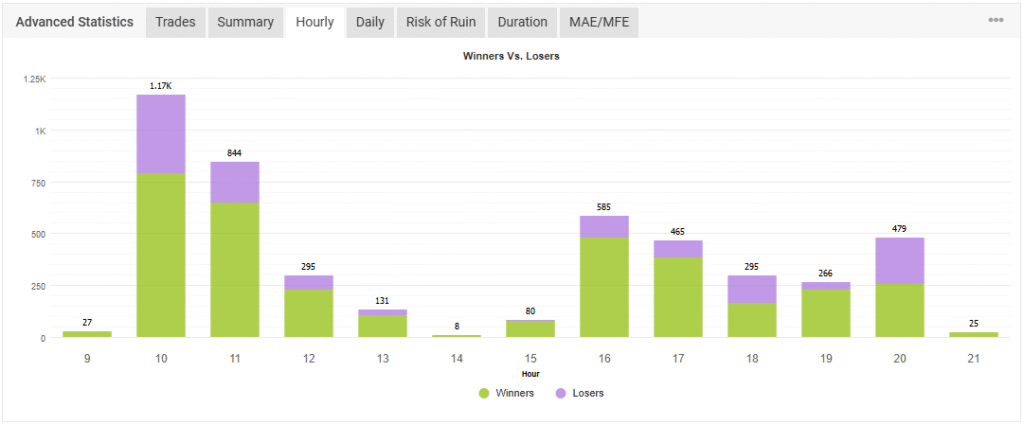
Trade volume peaks at Hour 9 with 1,170 winners and just 27 losses.
Hour 10 follows with 844 wins, confirming early-session dominance.
Performance remains consistent through Hour 18, with no erratic dips.
Friday is lightest, confirming strategic drawdown before weekend volatility
This strategy exploits time-based edge with precision not guesswork.

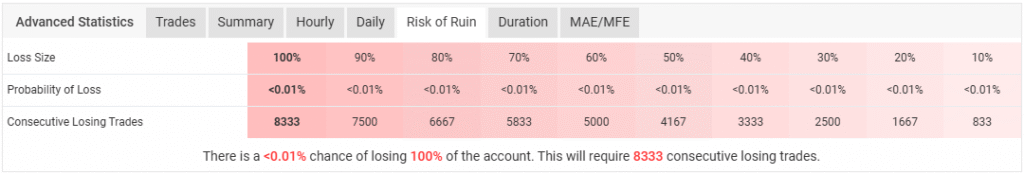
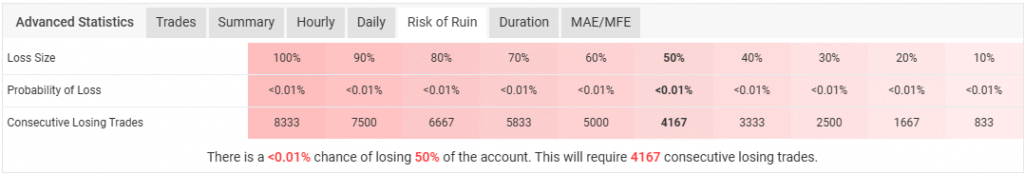
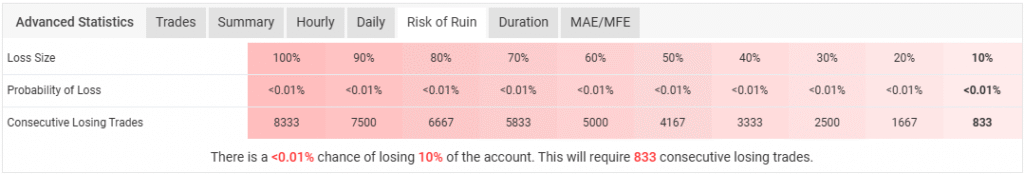
Risk of Ruin Tables
Probability of full account loss: <0.01%
To lose 100%, the system would require 8,333 consecutive losing trades.
Even a 50% drawdown would require 4,167 consecutive losses.
This isn’t luck. It’s statistical armor.


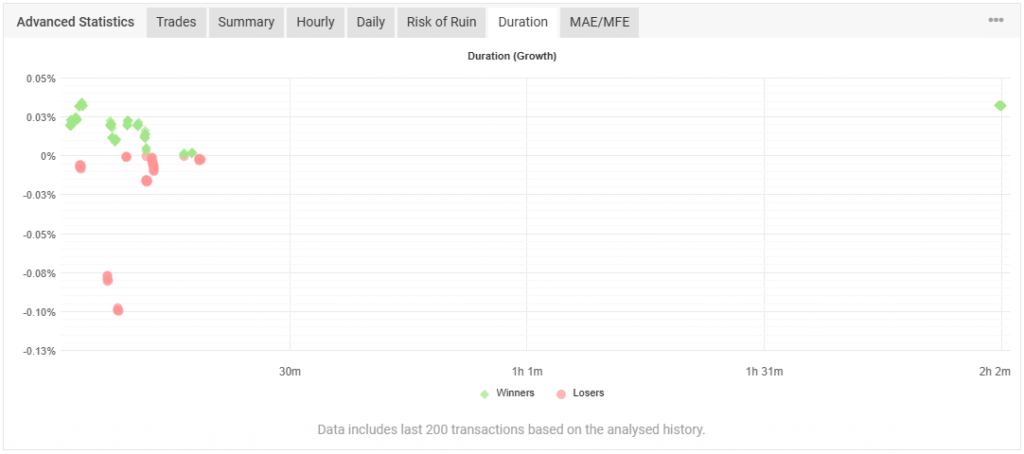
Duration vs. Growth Scatter Plot
Growth by Duration: Fast and Effective
Most trades close within 30 minutes, with winning trades consistently outperforming losers.
Green dots cluster above the zero line, confirming positive growth outcomes.
Short duration entries. Consistent results. No drift.
Potential Forecasted Profit

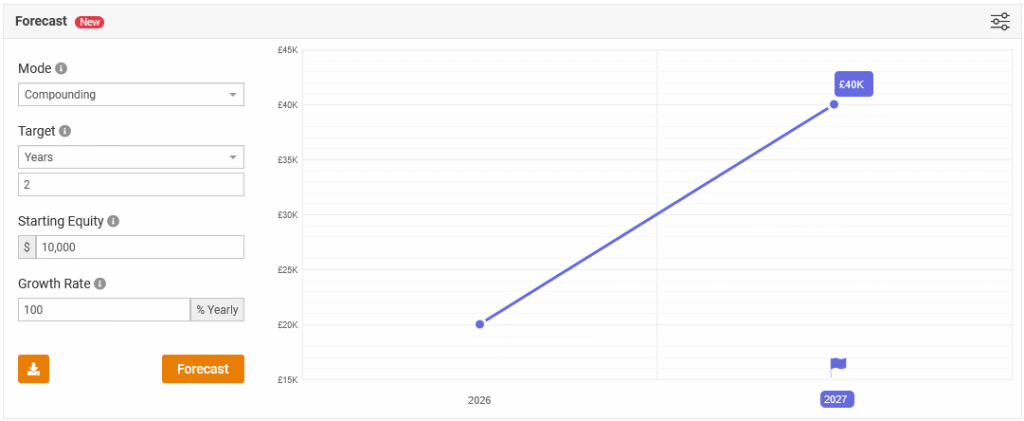
Forecast $10K, 100% Compounding
Forecast Model: Aggressive Strategy
Projected Equity: $40K by 2027
This model compounds annually, doubling equity each year.
Perfect for high-growth strategies where reinvestment drives the edge.
Starting Equity: $10,000
Growth Rate: 100% Yearly
Duration: 2 Years
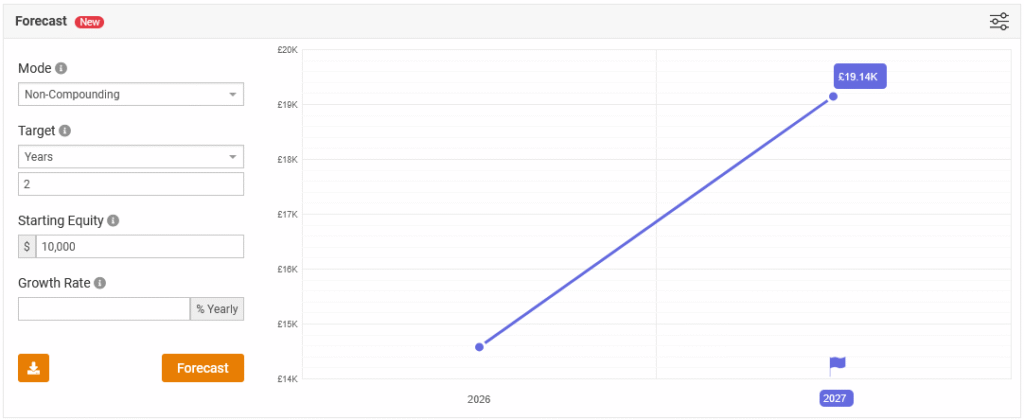
Forecast $10K, 8% Non-Compounding
Forecast Model: Steady Linear Growth
Projected Equity: £19.4K by 2027
This non-compounding model offers predictable yield ideal for investors seeking clarity without reinvestment complexity.
Starting Equity: $10,000
Growth Rate: 8% Yearly
Duration: 2 Years

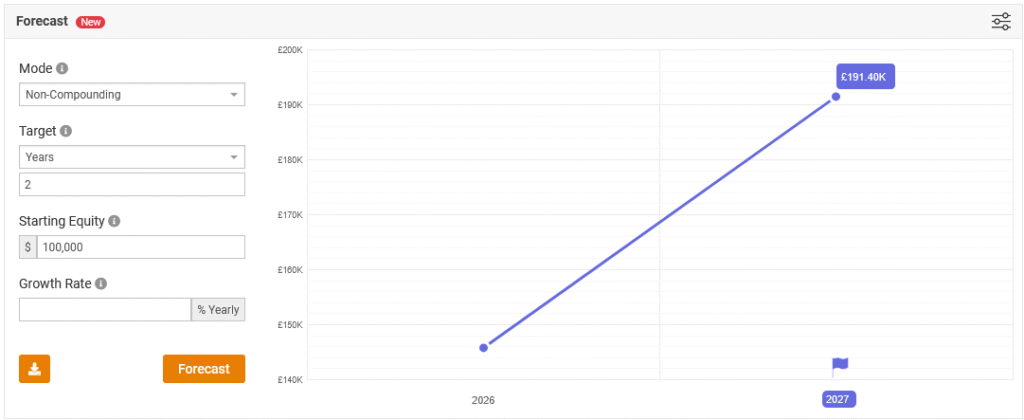
Forecast $100K, 38% Non-Compounding
Forecast Model: High-Capital Deployment
Projected Equity: £191.4K by 2027
Linear growth, no compounding. Built for capital pools focused on steady expansion.
Starting Equity: $100,000
Growth Rate: 38% Yearly
Duration: 2 Years
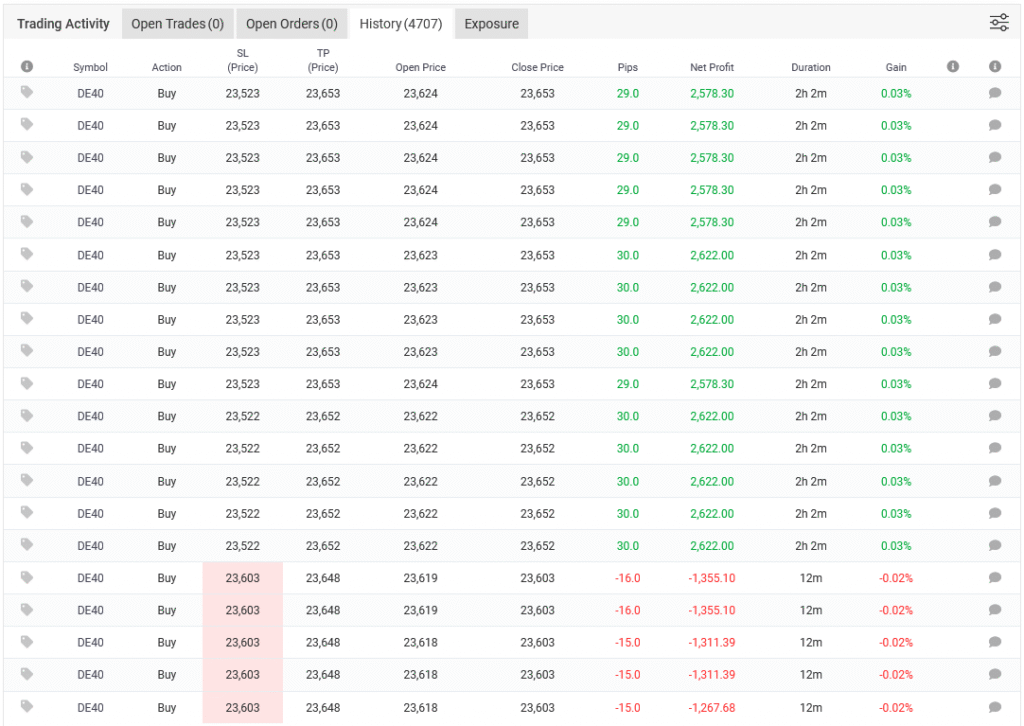
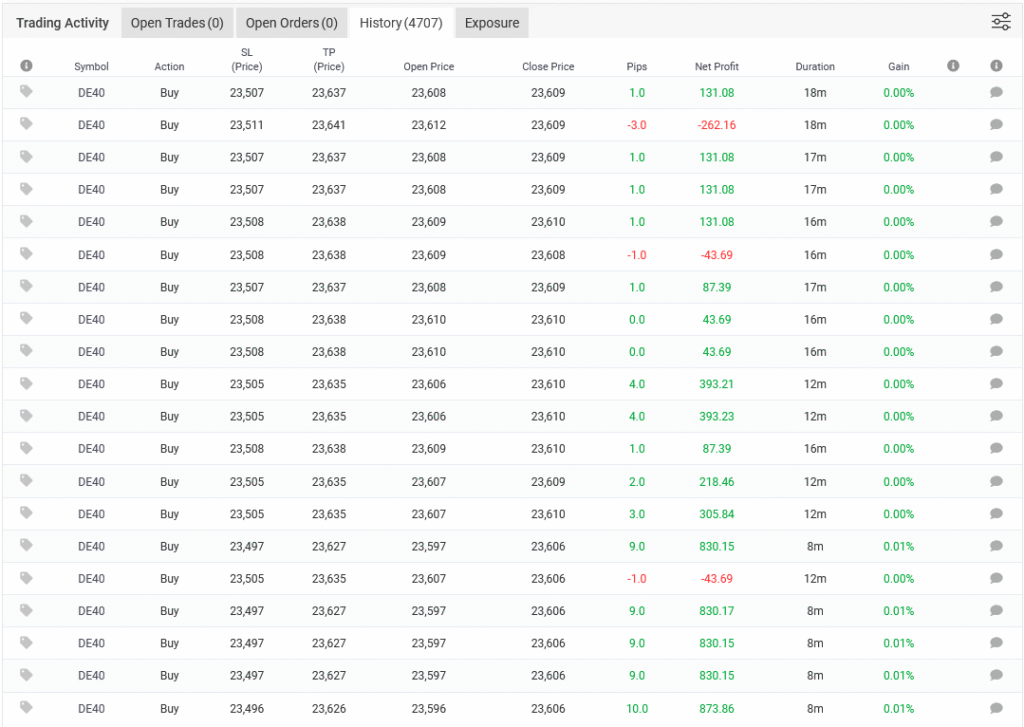
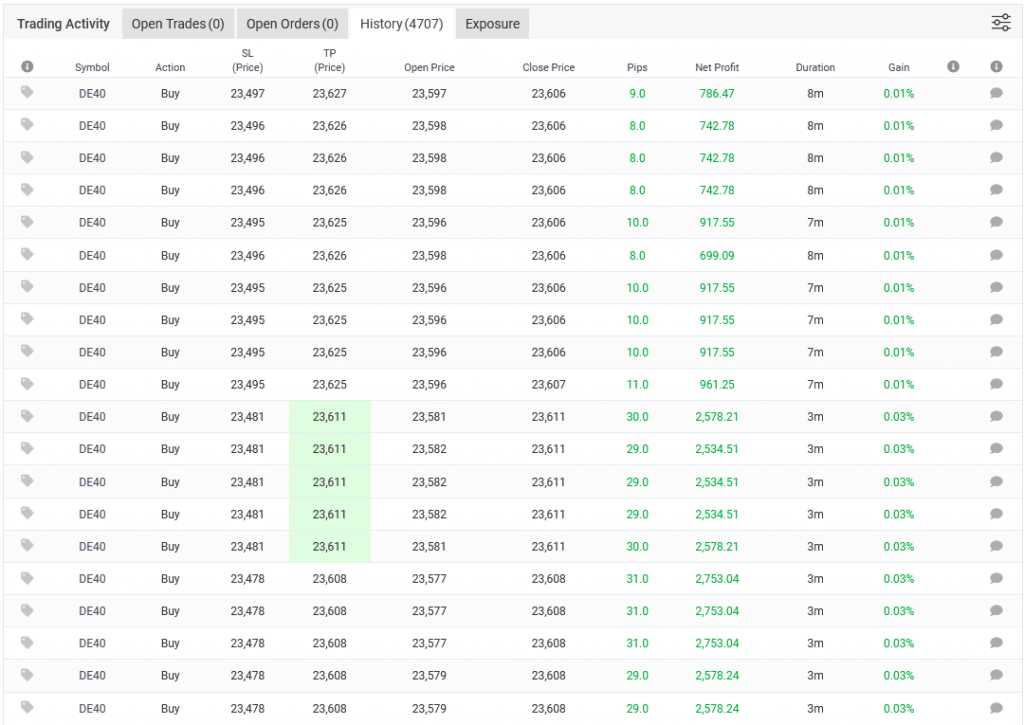
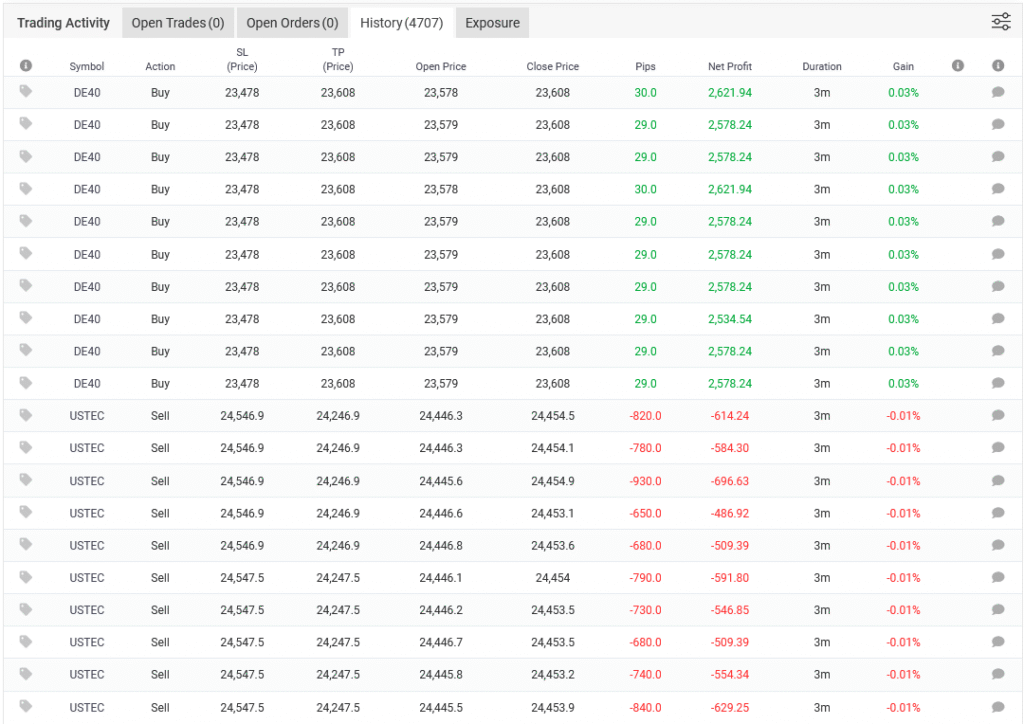
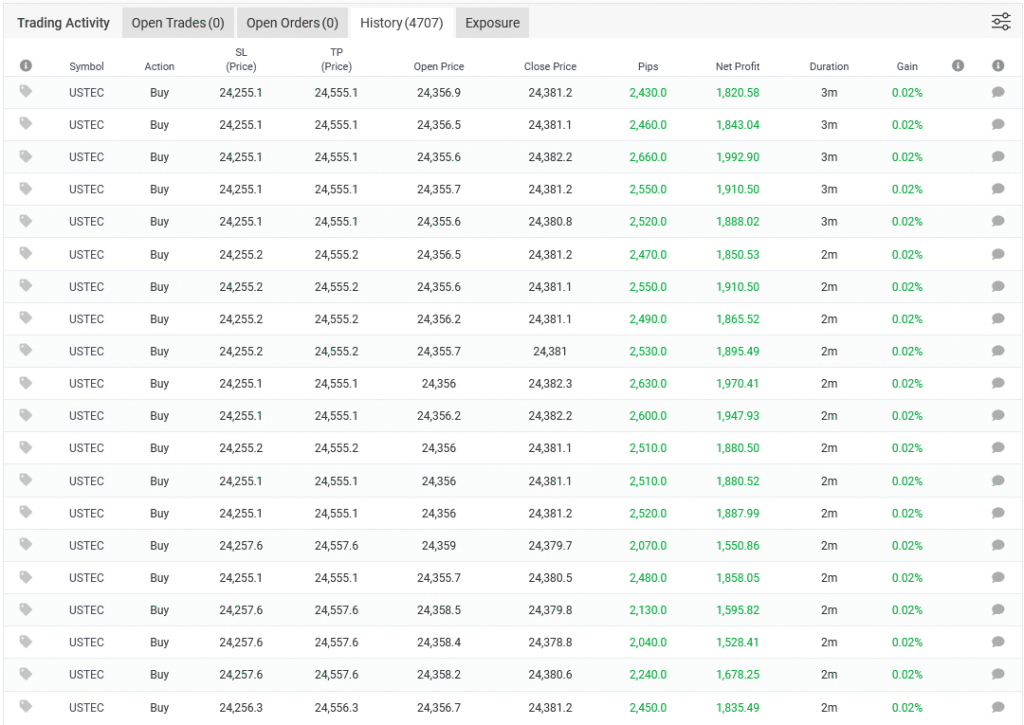
Snapshot of Trading Logs
Monthly Snapshot: August 2025
Monthly Gains: +21.02% and +18.46%
- Currency Allocation: USTEC (44%), USD (38.7%), US30 (9%), UK100 (8.3%)
- Currency Allocation: USTEC (44%), USD (38.7%), US30 (9%), UK100 (8.3%)
- Holding Times: Longs range from 4–10 days, Shorts from 1–5 days
Engineered repetition. No noise. No deviation.

Join to Discover Further
This isn’t a concept. It’s a fully robust system with hard metrics, clean execution, and transparent results. Every trade is tracked. Every asset is selected for performance. Every decision is backed by data.
There’s no guesswork. No overlays. No inflated claims.
If you’re serious about having your capital into a strategy that delivers consistent returns with full accountability, the next step is simple…