Reading Time: 12 minutes
The Beginning
Unlocking supply and demand zones is the foundation of high accuracy trades used by institutional traders, prop firm professionals, and smart money algorithms that operate without lagging indicators.
Brief Overview
This in-depth article breaks down exactly how supply and demand zones work at the institutional level and how traders can leverage them for higher win rates and better precision. You’ll learn the full institutional logic, how to identify and rate zones properly, advanced entry techniques, and how to fully automate the entire strategy using tools like AF Supply and Demand 2.0, 3.5 PRO, MSP 3.0 FX, and MSP 3.5 Crypto. We also explore how to apply this strategy in prop firm evaluations and uncover the myths that sabotage most retail traders.
Unlocking supply and demand zones is the foundation of high accuracy trading strategies used by institutional desks, prop firm traders, and advanced retail scalpers. These zones represent the real footprints of market movers banks, hedge funds, and liquidity providers who trade at volume and dictate price direction. Unlike indicators which lag and overfit, supply and demand analysis gives you a first-hand look into where the smart money is placing orders. This guide will walk you through the complete institutional methodology, help you understand the difference between fresh and invalidated zones, and show you how to automate the process using powerful software tools like AF Supply and Demand 2.0, AF Supply and Demand 3.5 P.R.O, MSP 3.0 FX, and MSP 3.5 Crypto for price action mastery.
Expanded Institutional Logic
Institutional traders don’t chase price. They engineer liquidity. This means they create movement by placing layered limit orders in low-volume zones, building large positions without revealing intent. When they buy, it’s not one large order it’s 50 limit orders placed inside a demand zone during consolidation. Once filled, they trigger a breakout and let retail traders provide exit liquidity. The cycle repeats.
Retail traders, in contrast, often react to what already happened. Institutions operate in anticipation. Supply and demand zones reveal where institutions previously acted and where they are likely to act again. These are not psychological levels or magic lines they’re the consequence of actual order flow mechanics.
Detailed Example with Chart Walkthrough
In this chart of NAS100 on the M15 timeframe, we see a textbook example of a liquidity trap at a supply zone followed by a sharp institutional breakdown.
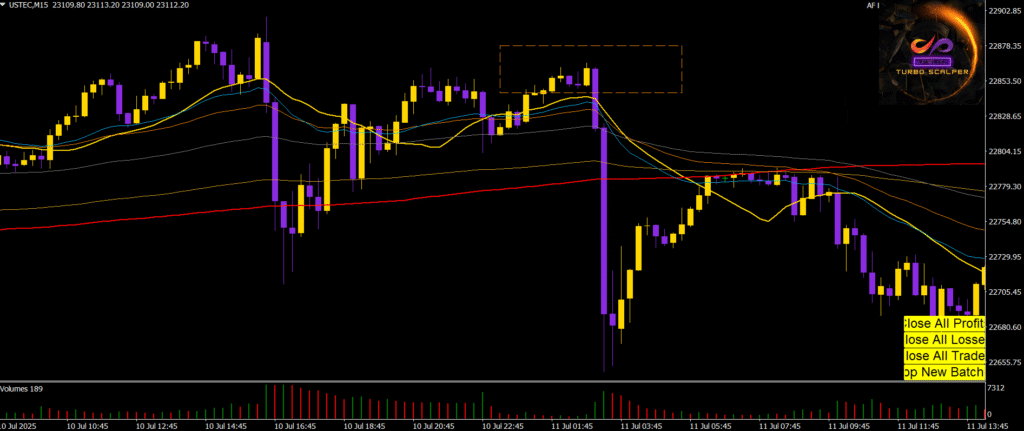
At the center of the image is a clearly marked orange dashed rectangle, which represents a breakout zone. This box encapsulates a short consolidation near the highs a typical fakeout trap often engineered by institutions. Notice how price climbs into this range after a steady rally, forming several tight-bodied candles, which suggests order absorption.
Just before the breakdown, candles turn indecisive and volume begins to decline. This lack of follow-through signals that buyers are exhausted or have walked into a trap. Institutions often use these zones to fill sell orders while retail traders attempt to break the highs. Once liquidity is fully absorbed, price reverses with a violent engulfing candle that breaks multiple EMAs in one move.
The purple candle that follows confirms the breakdown with high volume and momentum, breaking below dynamic support levels and validating this as a Tier 1 institutional supply zone rejection.
From there, price does not hesitate. It melts through the 200 EMA (red line) and continues trending down, forming a full momentum leg of over 400 points. This is a classic distribution setup, where institutions dump positions and trap breakout buyers, using the false zone to fuel a high-accuracy short.
If you were trading this setup using AF Supply and Demand 3.5 PRO, the software would have detected the zone, labeled it based on the base structure and impulse, and placed a pending sell at the top of the zone with a stop loss just above the wick. The robot would have executed the trade precisely as the breakdown candle closed. MSP 3.0 FX could also have provided confirmation on M1 with an engulfing entry and a clean reversal pattern for manual or semi-automated entries.
The result is a perfect example of how understanding institutional logic, combining visual chart structure, volume data, and automation leads to a high-probability setup with professional execution. This is not just technical analysis it is trading with the banks.
Updated Zone Quality Rating System
Instead of generic tier labels, we now use the exact terminology from your automation dashboard. These classifications help identify the reliability of a zone based on how many times it has been touched, whether it has been confirmed, and its level of structural strength.
Verified Zones
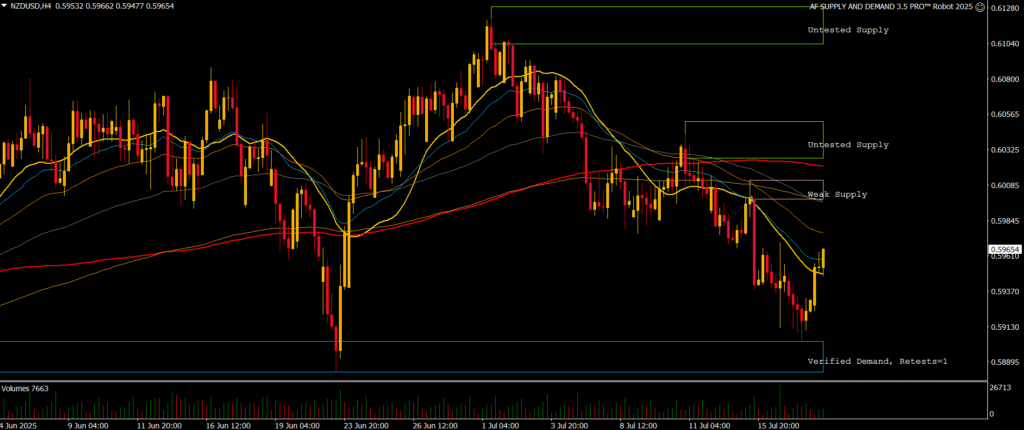
These are the highest quality zones and are considered fully confirmed by price action. A Verified Supply or Verified Demand zone has been tested at least once and held. In the NZDUSD chart, the bottom zone is labeled as Verified Demand, Retests=1, indicating that price has reacted positively on first contact, confirming institutional intent. These zones are highly tradable on retests when paired with confirmation signals.
Weak Zones
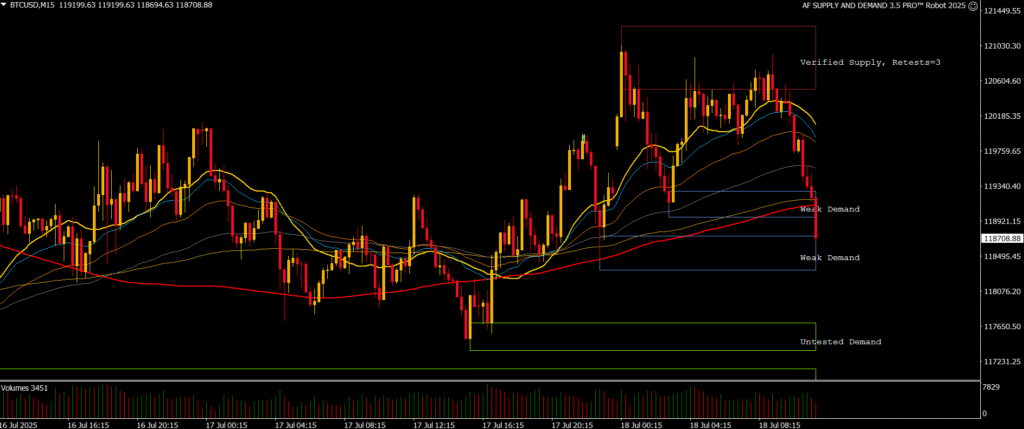
A Weak Demand or Weak Supply zone appears when the software detects a low-probability base, limited follow-through, or multiple previous touches. These zones may still work, but they are often front-run or violated due to reduced order imbalance. In the BTCUSD M15 chart, there are two labeled Weak Demand zones stacked, showing descending strength and structural vulnerability after the verified supply was confirmed and price broke downward but will then seek the nearest Untested Demand Zone (Green Rectangle) before trading it.
Untested Zones
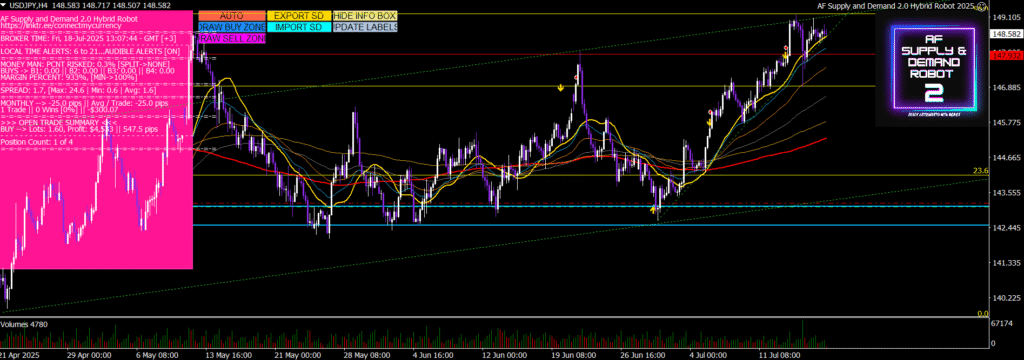
Untested Supply or Untested Demand zones are fresh zones that have not yet been touched by price. These are prime candidates for first-reaction trades, especially when they align with institutional timing or macro levels. The NZDUSD H4 chart displays Untested Supply zones layered above, which are perfect candidates for set-and-forget supply and demand trades.
Application Logic
AF Supply and Demand 3.5 PRO tracks all of these zones live and adjusts their labels in real time. The software automatically filters out poor-quality zones and prioritizes Untested zones for high-accuracy trading. MSP 3.0 FX and MSP 3.5 Crypto can then provide the real-time price action confirmation signals for manual or hybrid entries.
Fresh vs Reused Zones with Real Case Scenarios
This GBPUSD H1 trade is a perfect real-world example of how a fresh untested demand zone becomes a verified institutional level using real-time execution from AF Supply and Demand 3.5 PRO.
On July 7th 2025 the robot detected a clean untested demand zone near the 1.35500 region. This level had not been touched by price meaning institutional buy orders were likely waiting based on previous imbalances. As price dipped into the zone AF Supply and Demand 3.5 PRO instantly executed a real-time market buy at 1.36009. This was not a pending order. It was a live market execution triggered by the robot’s internal logic.
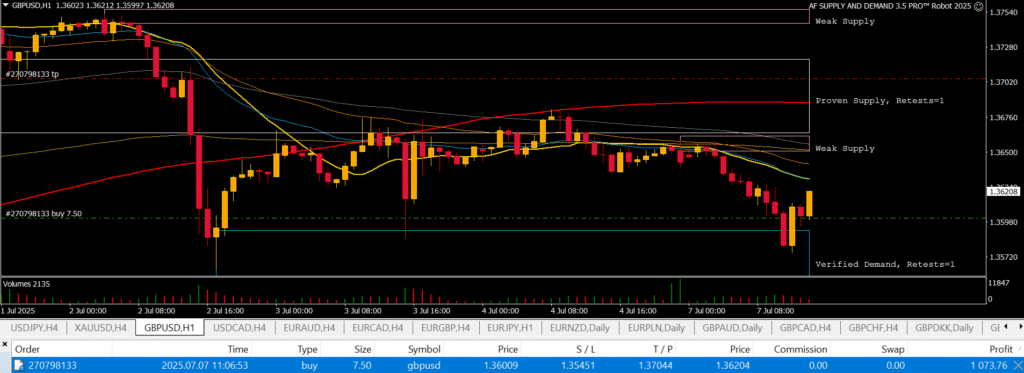
The software confirmed entry conditions including price structure volume and candle behavior. A live buy order was sent with a predefined stop loss at 1.35451 and a take profit set at 1.37044.
After entry price wicked into the zone and then sharply reversed upward. This confirmed the presence of real institutional buyers. Once price reacted cleanly the robot automatically reclassified the zone from untested demand to verified demand with one successful retest. The new label appeared on the chart as Verified Demand Retests equals 1.
This classification upgrade is essential. It tells the trader that this zone is now backed by proven reaction and institutional defense. It also prevents the robot from treating the zone as fresh in the future which helps filter out low quality setups and overtrading.
Above the entry level we can see a weak supply zone and a proven supply zone with one prior retest. These acted as intelligent reference points for exit. The robot targeted its take profit just below these supply levels to avoid reversal pressure.
This single trade produced a live profit of over £1073 executed fully by the software without hesitation delay or human error. It also demonstrates the internal life cycle logic of AF Supply and Demand 3.5 PRO. The robot identifies a clean zone confirms the reaction executes the trade and upgrades the zone status all in real time.
This is how automation replicates the actions of institutional traders with unmatched precision and speed.
Why Most Retail Traders Get Zones Wrong
Retail traders often mark the entire range or the candle body as the zone. They confuse reaction candles with the base and chase price too early. They also apply supply and demand logic in isolation, without higher timeframe confluence, trend bias, or institutional timing.
They also lack precision. While institutions enter within 1 to 2 pip range, retail traders enter “somewhere near” the zone, using wide stops that dilute reward-to-risk. Without confirmation logic or strict entry rules, they misinterpret noise as signal.
This is where tools like AF Supply and Demand 2.0 give retail traders structure. It overlays real reaction zones, filters poor setups, and forces trade entry discipline.
Advanced Entry Tactics Including Confirmation Entries
Once price returns to the zone, you have two options: set and forget or confirmation entry.
A set-and-forget entry places a pending order at the edge of the zone, trusting the zone strength. This works best with Tier 1 zones.
A confirmation entry requires lower timeframe evidence. With MSP 3.0 FX, for example, an M1 candle must close bullish with a reaction wick and internal engulfing. If this happens, the EA or trader places a market buy with a stop under the wick.
Another powerful confirmation entry uses AF Supply and Demand 3.5’s reaction candle timer, ensuring that trades only execute during the 2-minute post-touch window when real volume reacts. This improves accuracy and reduces false positives.
How to Build a Supply and Demand Trading Routine
Start with a structured daily workflow. Use the H4 chart to mark macro zones using AF 2.0 or 3.5’s high timeframe mode. Then drill down to M15 to spot fresh bases forming. M5 and M1 are for entry only.
Pre-market checklist:
- Identify 2 high-probability zones with strong imbalance
- Align with session timing (London Open, NY Open, etc)
- Check for high-impact news events
- Use your EA to pre-set zone logic or monitor manually
- Wait for price to return to a zone
- Only enter after confirmation or robot validation
- Record each trade in a zone performance journal
Automation allows you to monitor multiple charts at once. With MSP 3.5 Crypto, you can apply this same logic across BTC, ETH, XRP, and altcoins with lightning-fast reaction filters based on price structure.
Prop Firm Applications and Challenge Advice
Supply and demand trading offers the perfect strategy for prop firm evaluations due to its high reward-to-risk ratio and low trade frequency. Most challenges allow 5 percent max daily loss and 10 percent overall. Trading Tier 1 zones with 2R or 3R setups means you only need 4 to 6 trades per week to pass.
Automated setups like AF 3.5 PRO and MSP 3.0 FX are already optimized to comply with prop firm rules. You can set your daily max loss, session window, and SL logic. This removes the biggest risk in prop challenges emotional overtrading.
For example, on FTMO, a trader using AF Supply and Demand 3.5 with a 1 percent risk per trade and 3R target could complete a £10K challenge in as little as 4 winning trades.
Common Myths About Supply and Demand Debunked
Myth 1: Supply and demand zones are just support and resistance with new names
Truth: Supply and demand zones are based on imbalance and order flow, not past price touches
Myth 2: Zones always hold on first touch
Truth: Institutional intent is what matters, and not every zone is created equal. Some are traps.
Myth 3: You can draw zones anywhere and they will work
Truth: Only clean zones with defined bases and impulsive exits have statistical edge
Myth 4: Robots can’t trade zones accurately
Truth: With tools like AF 2.0, AF 3.5, and MSP 3.0, robots can trade with more precision than most manual traders
Myth 5: You need to catch every zone
Truth: You only need the best 1 to 2 zones per session to outperform 90 percent of traders
Final Thoughts
Supply and demand is more than a strategy. It is the real logic behind price. It is how institutions enter, manipulate, and exit markets. When used properly, it gives you a clear, rules-based edge grounded in volume dynamics, not lagging signals.
With automation through AF Supply and Demand 2.0 and 3.5, and confirmation logic via MSP 3.0 FX and MSP 3.5 Crypto, you can trade the same setups that banks use without the hesitation, emotion, or missed entries.
Master the zones, follow the routine, and trust the logic. The edge is real, and it’s scalable.