Trading without understanding supply and demand zones is like sailing without a rudder. In this quick 5-minute mini-course, I break down exactly how to spot these powerful zones using live charts on EURJPY and GBPCHF, helping you find high-probability, set‑and‑forget trade setups.
Why Supply and Demand Zones Matter
Supply and demand zones are at the heart of technical analysis. They highlight where major institutions place buy and sell orders.
- Demand zones reveal where price is likely to rise, as buyers re‑enter the market.
- Supply zones show where sellers have historically stepped in, often pushing price lower.
When used correctly, these levels give traders a clear view of market intent allowing better trade entries and exits with minimal guesswork.
Spotting the Zone: Step-by-Step Breakdown
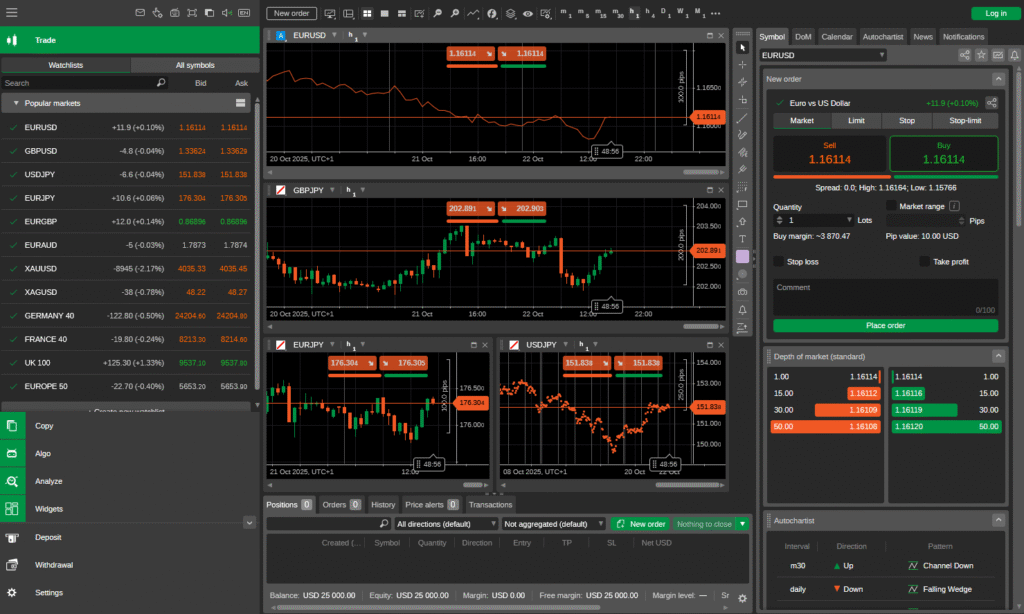
In the video, I demonstrate how I use my AF Supply and Demand 2 Software to quickly dissect market structure:
- Identify trend direction.
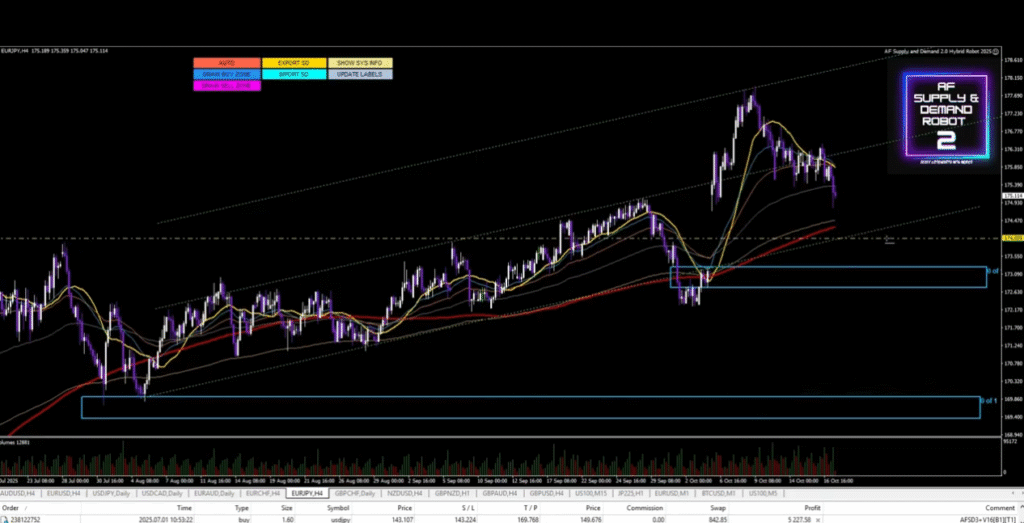
On EURJPY, focus shifts toward the buy zone once price respects previous lows and forms upward structure. - Locate gaps and reaction points.
Gaps often signal strong institutional moves, so these areas become great starting points for marking demand zones. - Draw confirmation trendlines.
Use trendlines (or what I call “TL”) to visually confirm direction. When trendlines align with a clean zone, probability increases. - Nest your buy and sell levels.
On EURJPY, buy zones sit around 173.276–173.300. GBPCHF shows a clean sell opportunity below the 177.338 level. - Update zones frequently.
Price evolves what once was supply can become demand once structure shifts. Always adjust as new candles form.
EURJPY Setup Recap
The EURJPY setup shows how a small 15‑30pip buy zone can catch a significant move.
Once price dips into the marked area and breaks back above the local trendline, it signals a potential rally toward higher resistance.
This simple method allows traders to look for low-risk, high-reward entries without overanalyzing the market.
GBPCHF Setup Recap
On GBPCHF, the focus was on shorting below key fib levels.
After price absorbed buy orders near the previous demand zone, momentum shifted lower, signaling clean sell pressure.
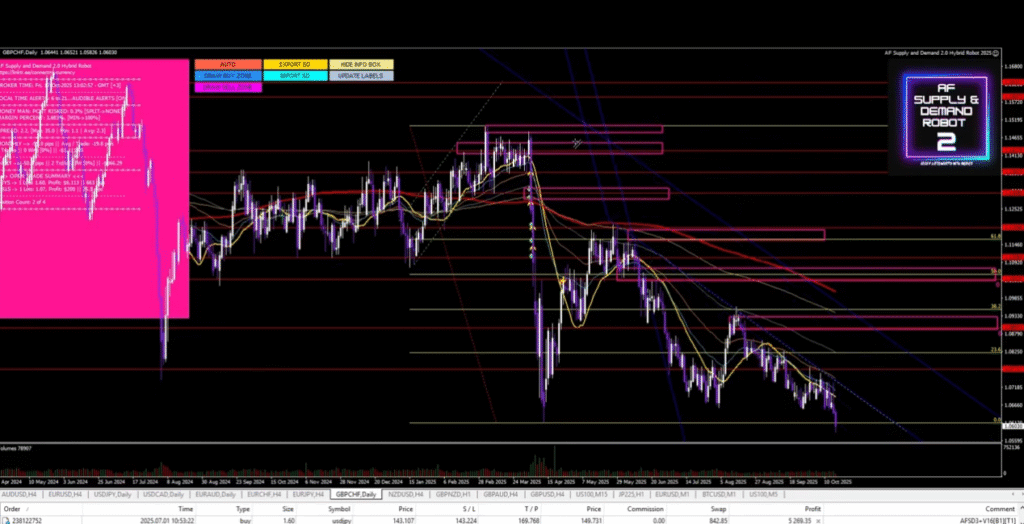
A small nested buy zone near 1.04323 was placed to watch for possible reactions or reversals.
Tools You Can Use
If you dont fancy using AF Supply and Demand you can also use platforms like Tradingview and cTrader.
- AF Supply and Demand Software for automatic zone drawing and automated trading.
These tools help simplify the process you draw, analyze, and act based on evidence, not emotion.
The end: Simplicity Wins in Forex
Spotting supply and demand doesn’t need to be complicated. By mastering these techniques, you create a trading style that works even when you step away from the charts the essence of set & forget trading.
Watch more supply and demand Training!
Watch the video here → My Youtube Channel
Get tools, templates, and full access → www.connectmycurrency.com/shop
Contact me on Telegram → @ewancmc
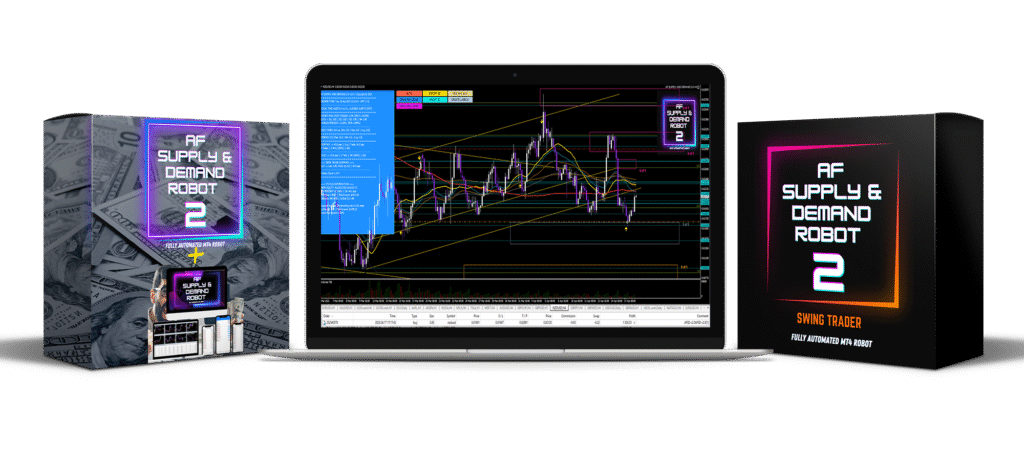
AF Supply and Demand Robot Comparison
£297
✦
Video lectures
✦
1x Robot Lifetime Access
✦
Downloadable resources
✦
1x Swing Trading Pack for 1 Month
This is an easy to use robot which requires members to update the Supply and Demand Zones twice a week with a 1x charting package for H4 Timeframes only and given in my community hub.
£797
✦
Video Lectures
✦
1x Robot One Year Access
✦
Downloadable resources
✦
7x Allstar Trading Packs: 1 Month Access
This is the same thing as AF Supply and Demand 2.0 Hybrid but now you have access to 7x charting packages which range from M15 Timeframes to Monthly which have to be uploaded once a week.
£497

✦
Video Lectures
✦
1x Robot Lifetime Access
✦
Exclusive Community Access
✦
Unlimited: Trades Every Asset
This is the complete all in bundle which trades Supply and Demand through automatic zone detection accross ANY Asset and ANY Timeframe! No uploads required!