Reading Time: 6 minutes
Introduction
The Australian Dollar (AUD/USD) is sitting near major accumulation levels just as the U.S. government enters a Prolonged Shutdown, Treasury yields wobble, and Gold trades above $4,100 per ounce.
For disciplined traders mapping the market through structure, this moment offers a textbook opportunity to blend fundamentals with high-probability technical setups.
This week’s analysis focuses on the convergence between macro pressure on the USD and AUD demand zones that align with your proprietary support structure: Blue Demand Zones for Buying Pullbacks, Orange Trendlines for Weekly trend confluence, and Red for Monthly structural direction.
Fundamental Breakdown
U.S. Government Shutdown: A Short-Term USD Headache
The ongoing U.S. government shutdown has frozen nonessential spending, delayed key economic reports, and injected short-term uncertainty into bond markets.
While risk sentiment remains mixed, the result is clear: reduced investor appetite for holding USD liquidity until Washington resolves its budget impasse.
Historically, government shutdowns trigger temporary DXY weakness as investors hedge in gold and high-beta currencies. That pattern is already visible as AUD/USD steadies near 0.6480.
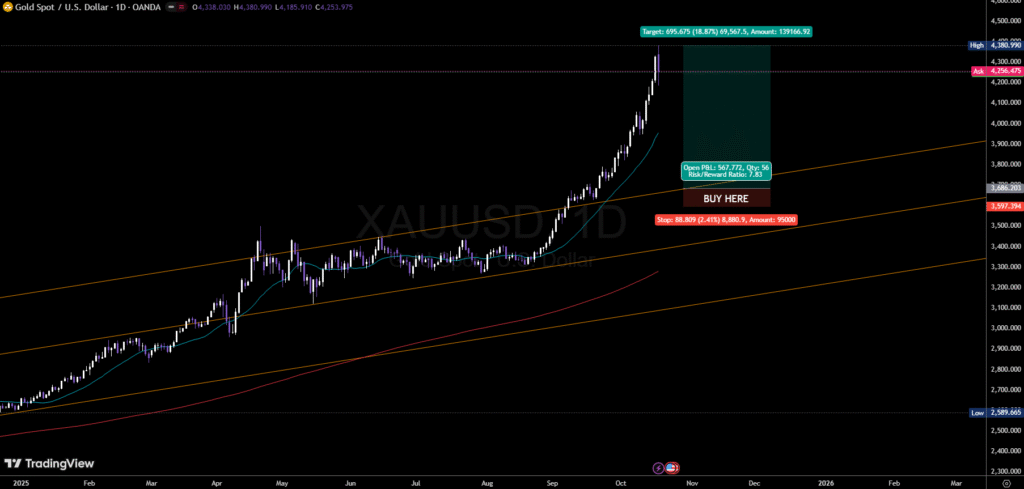
Gold Above $4,100: Commodity Momentum Boosting the AUD
Australia’s commodity-linked currency benefits directly from gold’s strength.
At $4,100 to $4,200 per ounce, gold is trading at all-time highs, supported by persistent inflation fears, central-bank accumulation, and safe-haven demand from fiscal uncertainty.
This record pricing strengthens the AUD’s macro foundation, providing additional confirmation that dips into the Blue Demand Zones carry real institutional confluence, not just technical validity.
The RBA: Neutral, Not Dovish
While some traders expect the Reserve Bank of Australia (RBA) to pivot dovish, the data doesn’t support it. Inflation remains sticky, and the RBA’s tone has been consistently cautious but firm.
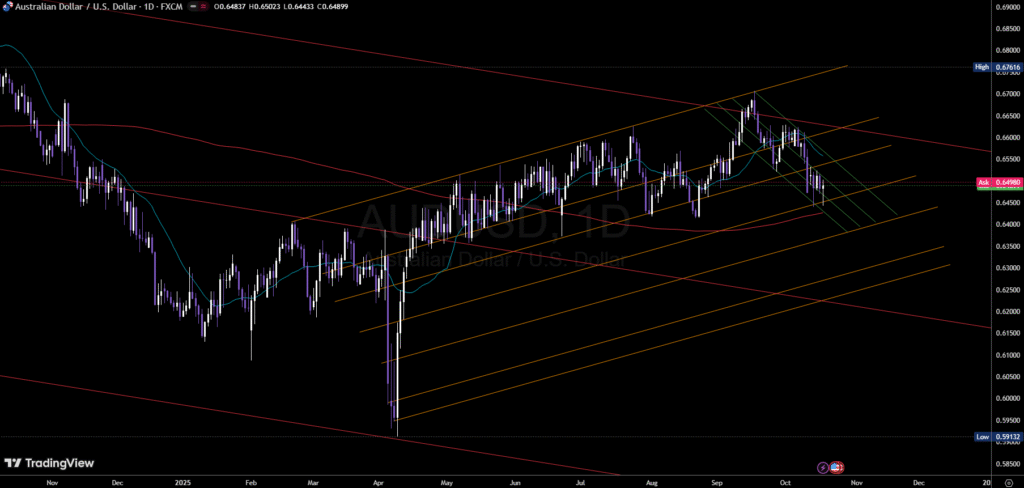
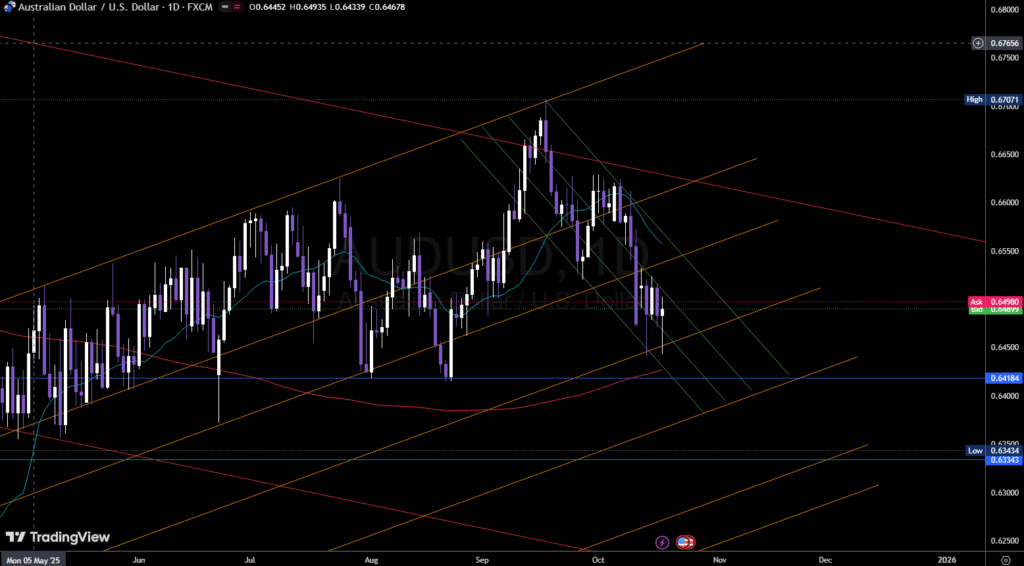
That makes the AUD defensive, not weak, giving every demand-zone reaction a stronger probability of follow-through. Heres a Snapshot of the weekly trend (Orange) for the AUDUSD.
The U.S. Side: Dollar at Crossroads
The USD’s medium-term trend remains supported by high yields, but the shutdown has temporarily softened momentum.
If Congress fails to resolve funding soon, further USD weakness could drive reactive surges from AUD demand clusters, especially between 0.6418 and 0.6334.
If the shutdown is resolved quickly and Treasury yields rebound, the deeper confluence zones around 0.6200 to 0.6130 could come into play.
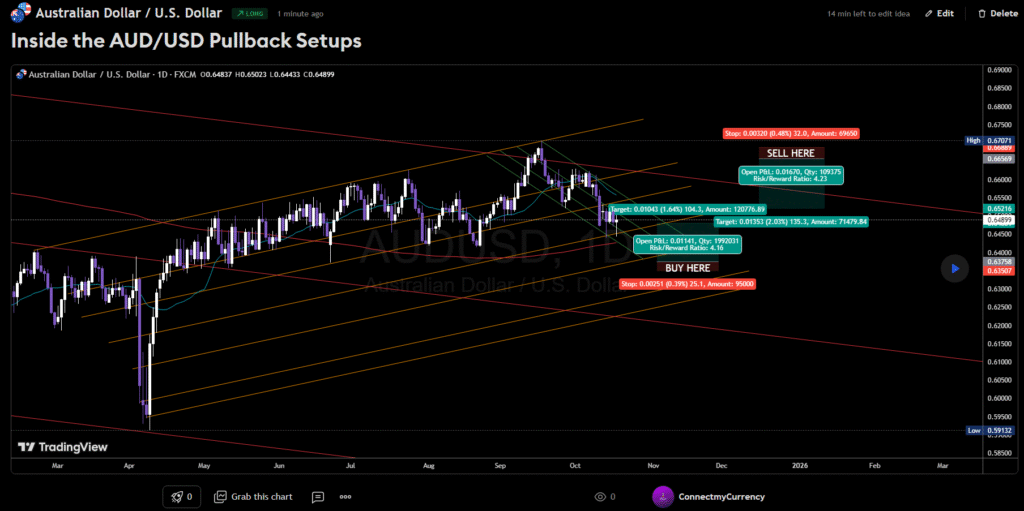
Technical Outlook
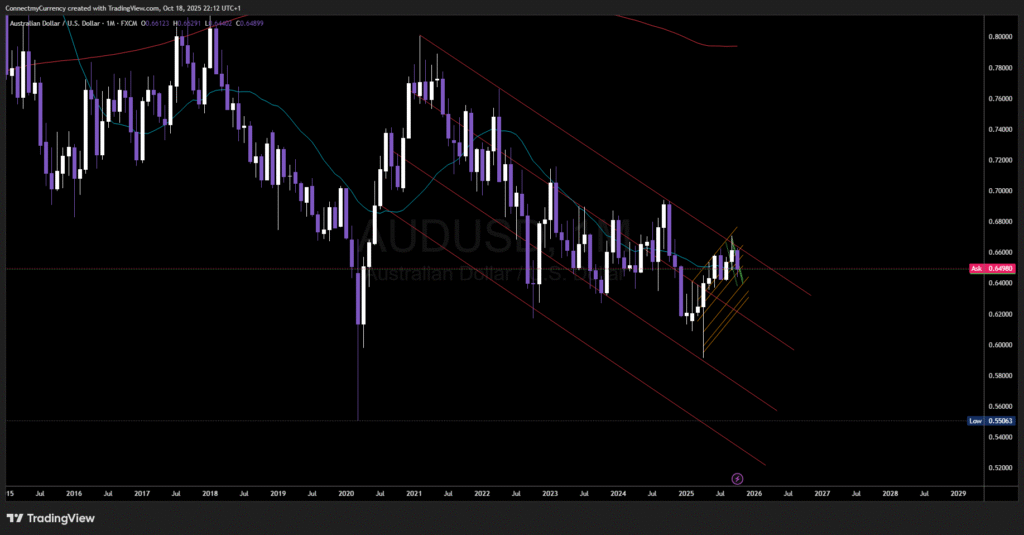
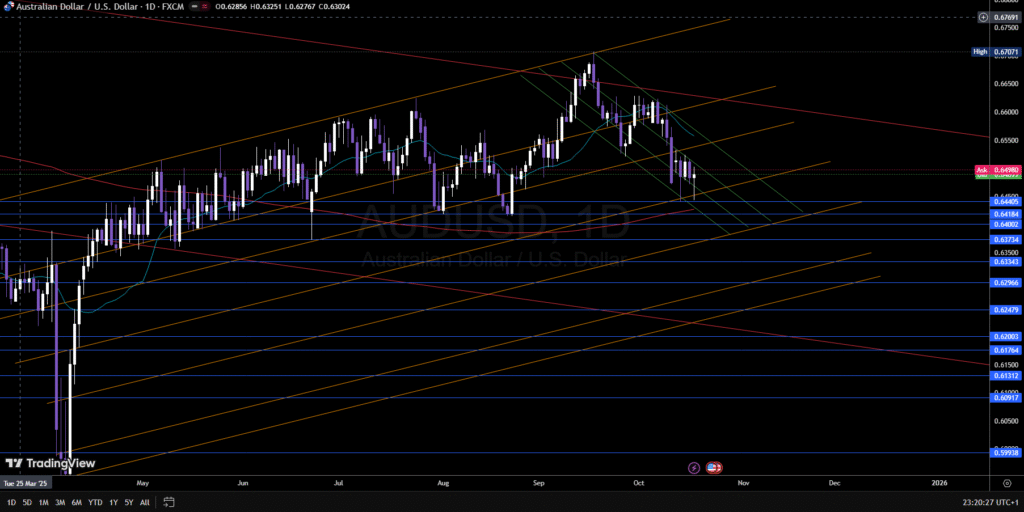
Your updated chart shows AUD/USD locked within a descending green daily channel, still guided by long-term red monthly resistance and orange weekly trend structure.
Each Blue Demand Zone represents a Pullback trade with a 30–50 pip stop-loss.
The goal is to catch clean moves from institutional demand, taking partial profits at 30–50 pips and holding extended targets up to 80–200 pips depending on higher-timeframe confluence.
Full breakdown below.

Confirmed Buy Zones
| Zone (AUD/USD) | Timeframe Confluence | Fundamental Alignment | Expected Reaction Range |
|---|---|---|---|
| 0.64405 – 0.64184 | Daily demand base | USD weakness from shutdown, gold > $4,100 | 50–80 pips |
| 0.64002 – 0.63734 | Daily channel continuation | Short-term DXY pullback zone | 60–90 pips |
| 0.63343 | Weekly demand | Moderate USD softening, AUD defensive stance | 100 pips |
| 0.62966 | Weekly/Monthly overlap | Confluence support | 120–150 pips |
| 0.62479 – 0.62003 | Monthly demand | Strong reaction zone with RBA stability | 150–180 pips |
| 0.61764 – 0.61312 | Monthly demand cluster | Oversold AUD with gold strength | 200+ pips |
| 0.60917 – 0.59938 | Deep macro zone | Crisis-level pricing with long-term accumulation | 250–300 pips |
| 0.59132 | Cycle low | Ultimate structural floor | 400 pips macro reversal |
Technical Summary
- Current Bias: Bullish from Blue Demand Zones only (reactive pullbacks, not trend breaks)
- Risk Plan: Use a 30–50 pip stop-loss per entry zone, scaling up position size as confluence increases
- Daily Channel: Still sloping down but price is consolidating near demand edges
- Monthly Trend: Red structure remains bearish but losing momentum
- Execution Plan:
- Start light near upper zones (0.6440–0.6370)
- Add exposure deeper toward 0.6330–0.6200
- Target 80–200 pips depending on the strength of the reaction
Macro-to-Micro Confluence Snapshot
| Macro Driver | Impact | Trading Implication |
|---|---|---|
| U.S. Government Shutdown | Weakens USD temporarily | Increases AUD/USD rebound probability |
| Gold above $4,100 | Reinforces AUD strength | Adds confirmation for longs at demand |
| RBA Neutral Policy | Provides defensive AUD tone | Prevents deeper structural breaks |
| High U.S. Yields | Caps upside rallies | Use partial profit-taking on 80–100 pip moves |
| China Stabilization | Supports commodity flow | Adds weight to mid-zone holds |
Key Takeaways
- AUD/USD is technically compressed but fundamentally supported.
The U.S. fiscal shutdown and record gold levels create temporary AUD tailwinds. - Our Blue Demand Zones are the roadmap.
Each represents a structured pullback trade with a 30–50 pip stop-loss and clear reward targets. - Focus on reactive longs, not trend continuation.
The macro structure remains bearish overall, but reaction rallies can deliver high-probability profits. - Watch 0.6330–0.6200 carefully.
This zone aligns monthly support with gold correlation and USD weakness. - Stay flexible.
A rapid U.S. resolution or yield spike could shift momentum back to deeper structural zones.
ending
The current AUD/USD environment offers a rare moment of clarity.
Macro fundamentals such as the government shutdown and record gold prices favor near-term rebounds.
Technical demand zones align precisely with these catalysts.
The RBA remains neutral enough to maintain AUD resilience.
Until U.S. politics stabilize or DXY breaks decisively higher, every dip into your Blue Demand Zones is a structured, data-backed opportunity for disciplined longs with 30–50 pip stop-loss management.
Join Thousands of Funded Traders Scaling with FTMO
Funded trading has become the smart path for serious traders.
Our readers are passing their challenges and managing real capital using the same Blue Demand Zone setups shared here.
Start your journey with 19% off your $100K FTMO Challenge using the link below.
Suggested Read Next
- The Zero Property in Trading: Why 95% of Skilled Day Traders Fail (And How to Join the 5% Who Succeed)
- The 10 Most Common Questions New Investors Ask
Trading Risk Disclosure
Trading Disclaimer:
The information provided in this article is for educational and informational purposes only and does not constitute financial advice, investment advice, trading advice, or any other form of advice. Connect My Currency is not a registered financial advisor and does not make any representations that the strategies or opinions expressed will result in profits or prevent losses.
Trading and investing in financial markets involves significant risk and may not be suitable for all investors. Past performance is not indicative of future results. Before making any investment or trading decision, you should carefully consider your financial situation, risk tolerance, and objectives, and consult with a licensed financial professional if necessary.
By using the information in this publication, you agree that Connect My Currency and its affiliates are not responsible for any direct, indirect, or consequential losses arising from the use or reliance on the content provided.